
The Three Pillars of Risk Modeling: Part 2
Exposure and Vulnerability
Welcome to part 2 of our blog series on The Three Pillars of Risk Modeling: Hazard, Exposure, and Vulnerability. In part 1 we introduced and provided definitions of each of these three components of risk while focusing on the more physical component: hazard [1]. In this blog post, we investigate exposure and vulnerability more deeply and consider the inherent interplay between the two. Our goal by the end of this post is to provide a more balanced and complete understanding of risk.
As mentioned previously, exposure is a wide-ranging concept used to refer to the people, livelihoods, environmental services and resources, infrastructure, and/or economic, social, and cultural assets in places that could be negatively impacted by physical events (hazard) and which are therefore subject to potential future harm, loss, or damage (vulnerability) [1, 2, 3]. Vulnerability refers to the tendency of exposed elements such as human beings, their livelihoods, and assets to suffer negative effects when impacted by hazards [1, 3]. The purposes for which the risk assessment results will be used should dictate the required resolution and types of exposure data, hazard data, and damage functions that will be used [1].
While exposure and vulnerability are distinct, they are related when understanding risk. Exposure is a necessary, but not sufficient, determinant of risk [3]. It is possible to be exposed but not vulnerable to a hazard (for example, by living in a house near the ocean that is elevated and engineered to withstand high winds) [3]. On the other hand, to be vulnerable to an extreme event it is necessary to also be exposed [3]. For cities with population greater than 300,000 around the globe, Figure 1 shows their exposure to natural hazards and Figure 2 shows their vulnerability to economic losses. Note that some cities such as Cairo have low exposure to hazards but are vulnerable to economic losses, whereas others, such as Ulaanbaatar, can be exposed to hazard but not be vulnerable to economic losses. Extreme events are natural events. “Natural disasters” occur when vulnerable exposures experience extreme events.
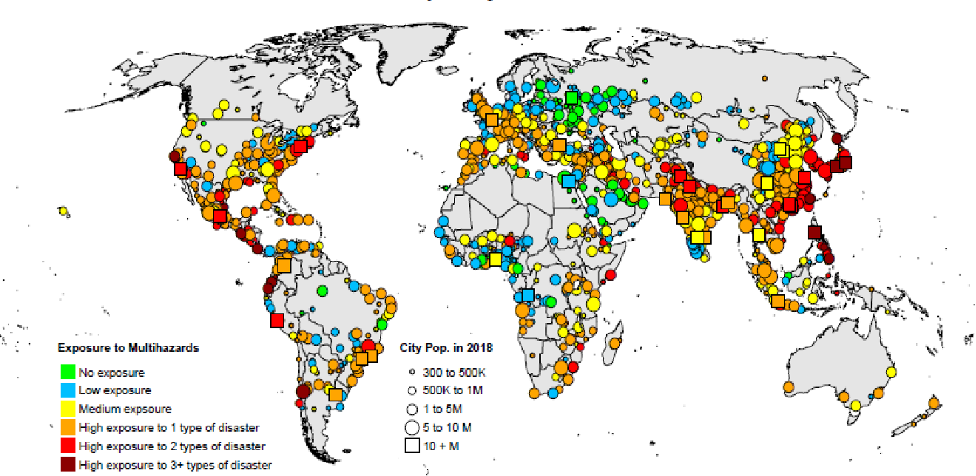
Figure 1: Location of cities by population size and level of exposure to natural hazards. Figure and source material borrowed from: https://www.semanticscholar.org/paper/Exposure-and-vulnerability-to-natural-disasters-for-Gu/f92450b3dc3de503d83143a7043af31d31735409.
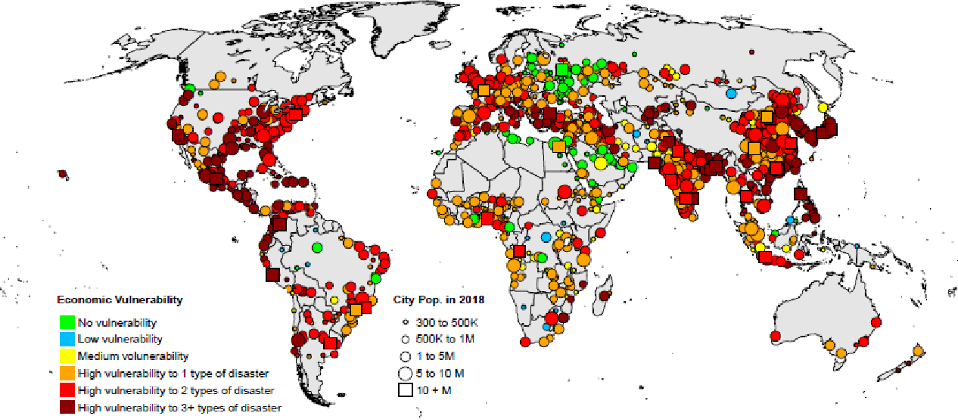
Figure 2: Location of cities by population size and level of vulnerability to disaster-related economic losses. Figure and source material borrowed from: https://www.semanticscholar.org/paper/Exposure-and-vulnerability-to-natural-disasters-for-Gu/f92450b3dc3de503d83143a7043af31d31735409.
Vulnerability is usually quantified using functions/equations that describe damage or loss [1]. These functions are specific to exposure type and hazard and account for the response of the exposure to hazard intensity. [1]. A damage function quantifies the impact of a hazard is through a damage ratio from 0 to 1, where 0 represents no damage to a building and 1 represents complete destruction [1]. Loss can be determined by multiplying the damage ratio by the present value of the exposure [1]. Damage functions exist for a wide range of exposure types. Some of these can account for detailed information about a structure, such as its date of construction or the number of stories [1]. Vulnerability functions can also be used to estimate aggregate regional loss where site-specific data is not available [1]. This aggregated loss can be in terms of GDP, fatalities, economic loss, or other metrics [1]. Collecting and analyzing data from previous disasters can also provide insight on physical, social, and economic aspects of vulnerability. Efforts to quantify socioeconomic vulnerability and poverty remain limited, and therefore this information is rarely incorporated into risk assessments [1].
The availability of open source, global data sets on population, building types, and satellite imagery provides opportunities to model exposures globally at higher and higher resolutions [1]. In the last few decades, such datasets have allowed for first estimates of global exposure to storm surges [4], earthquakes [5], river floods [6], and hurricanes [7]. Meteorological information from satellites continues to provide useful, high-resolution imagery regarding flood risks [1]. There has also been increased interest in the use of drones over the last decade to provide even more detailed snapshots that can be used to assess exposure [1]. At national and subnational levels, data from government agencies are increasingly being used to understand risk from the national level all the way down to individual communities [1].
To reduce exposure to hazards and thus decrease overall risk, land use and community planning must be key considerations [3]. The environment offers resources for the development of human settlements while simultaneously providing exposure to intrinsic and shifting hazards [3]. Global population growth, the varied locations of human settlement, and the gradual decrease in the availability of safer lands mean that it is almost impossible that humans will be able to locate in areas not subject to environmental hazards [3, 8]. When exposure to these physical events is impossible to avoid, appropriate land use planning and judicious decision-making on where to locate must be accompanied by other methods for mitigating risk [3]. For example, as the United States has grown and expanded over the last century, many large metropolitan regions have ballooned along coastal regions that are particularly vulnerable to the impacts of climate change, sea-level rise, and hazards such as storm surge [9]. The focus for these communities is to reduce future risk [3, 9] using adaptative strategies such as better building codes, managed retreat from the ocean, and the use of green infrastructure.
Overall, there is high confidence among the disaster community that although hazard events are usually considered the cause of disaster risk, vulnerability and exposure are its key determining factors [3]. In addition, while people have little influence over the hazard, vulnerability and exposure can often be influenced by policy and decisionmaking, both in the short and medium term [3]. Figure 3 provides a summary of the flow of information used to generate an appropriate risk assessment in a risk model.
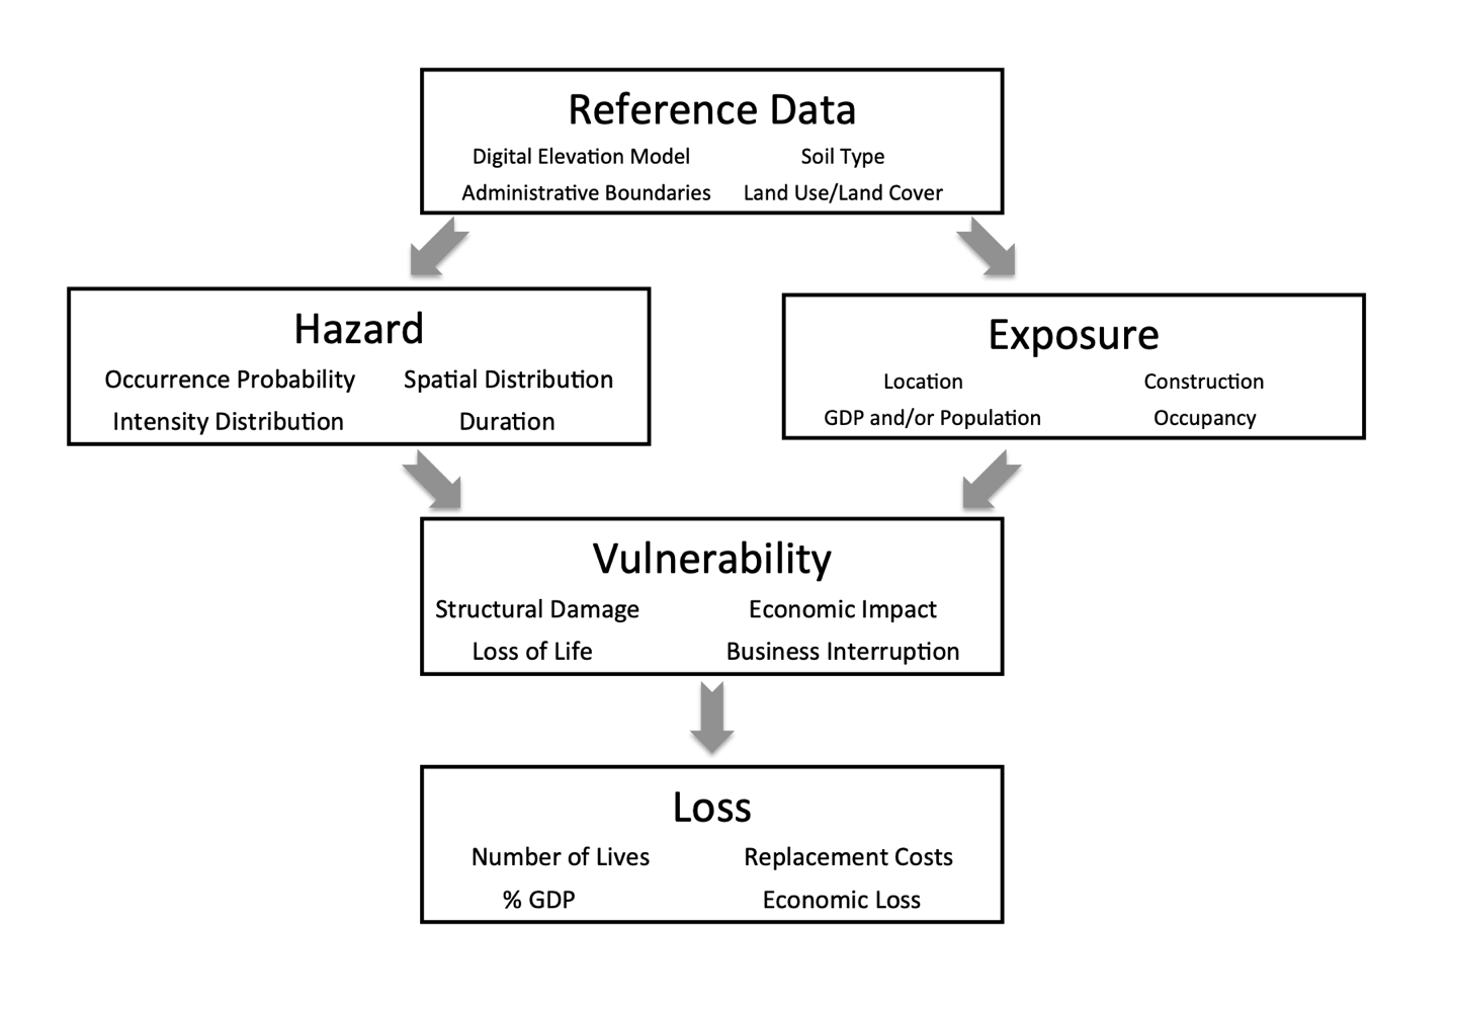
Figure 3: Schematic outlining the flow of information in a risk model needed to generate a risk assessment of the loss.
References
1. http://dx.doi.org/10.1108/IJDRBE-06-2015-0033
2. https://www.ilankelman.org/crichton/1999risktriangle.pdf
3. https://www.ipcc.ch/site/assets/uploads/2018/03/SREX_Full_Report-1.pdf
4. https://www.nature.com/articles/nclimate1979
5. https://www.researchgate.net/publication/289007245_Natural_disaster_hotspots_A_global_risk_analysis
6. https://www.sciencedirect.com/science/article/abs/pii/S0959378012000830
7. https://www.nature.com/articles/nclimate1410
8. https://www.scirp.org/reference/referencespapers?referenceid=1838992
9. https://www.epa.gov/climateimpacts/climate-change-impacts-coasts