Custom Risk Modeling
While historical or real-time events are indicative of what could happen, a probabilistic risk assessment, or another custom risk modeling approach, provides a more complete view of the probability of experiencing extreme events and damage. Kinetic Analysis Corporation uses the same suite of models for both real-time, historical, and custom hazard assessments and damage estimation.
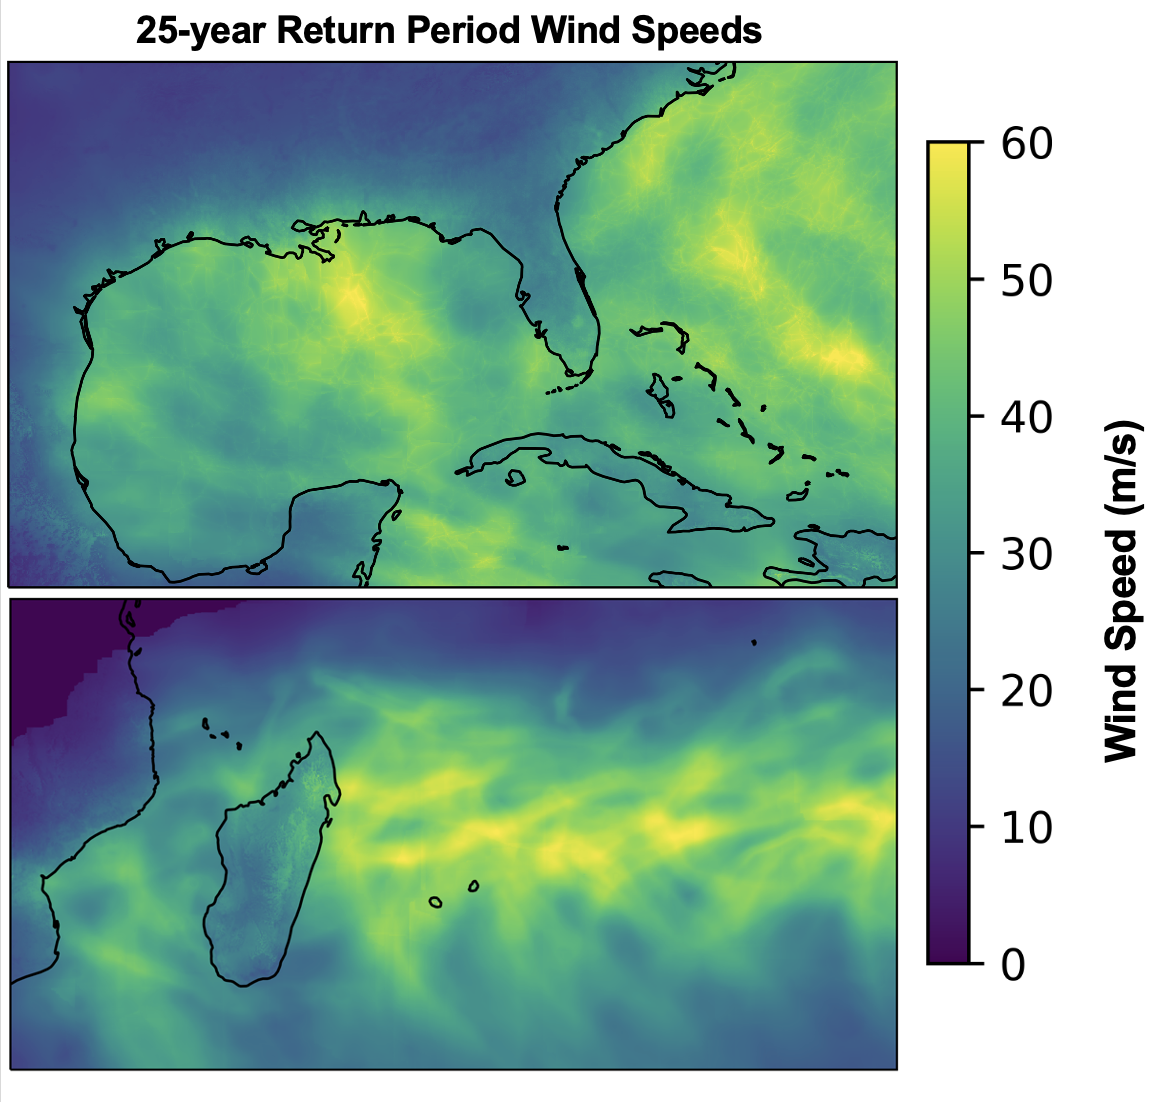
One custom product we provide is return period maps based on the historical record. The wind speed return period is best thought of as the annual probability of meeting or exceeding the winds shown for a given return period. The return period is equal to the inverse of the probability. For example, a 25-year return period for an event is equal to a 0.04 probability, or a 4% chance, of occurrence.
The 25-year return period wind speeds shown in the top figure are based on the National Hurricane Center's best-track data for tropical cyclones that occurred from 1950 through 2021. The winds shown in the bottom figure are based on the Joint Typhoon Warning Center's best-track data for tropical cyclones that occurred from 1980 through 2021. The winds represent terrain-adjusted, 1-minute sustained winds at 10 m elevation. Note that winds equal to or faster than the return period winds can occur more than once in a year, or in consecutive years.
HAZARD INTENSITY
Kinetic Analysis Corporation offers annual and occurrence probability of exceedance curves for the intensity of wind, wave and storm surge from tropical cyclones. The units for hazard intensity can be customized for a client. For example, winds can be provided as 10-minute or 1-minute sustained winds or as gusts over a specified time at 10 m height in open terrain. Consistent with our multi-model approach, winds, waves and storm surge return period can be generated using a variety of models.
DAMAGE RATIOS
Consistent with Kinanco’s multi-model, global approach, we offer exceedance probabilities for damage ratios based on eight damage function families for any location and a wide range of asset classes. Structural damage functions account for damage due to tropical cyclone winds and tropical cyclone-generated storm surge and waves. When there is damage to the envelope of a structure, damage its contents is also estimated.
Damage ratio exceedance probabilities are available for variety of high-level asset classes. In addition, we can provide damage ratios for selected client-specific asset classes.
LOSS RATIOS
Loss ratios are used to estimate the economic damage from an event. We distinguish between damage and loss ratios as a structure that is, for example, 80% damaged, will likely be declared a total loss so that the loss is greater than the damage ratio would imply.
As with damage ratios, loss ratios are available for a wide range of asset classes.