
The 2025 Hurricane Season Is Here: What are the Experts Predicting?
Introduction
The 2025 hurricane season is underway. The last several years have featured a string of active hurricane seasons with multiple major hurricane landfalls on United States soil [1]. With recent storms like Laura, Ida, Ian, Idalia, and, of course, last year’s hurricanes Helene and Milton, it’s likely that residents along the Gulf Coast are more wary this year about another major strike. As with any season, it is impossible to predict exactly who will be affected this far in advance. Nevertheless, we can look at some early ocean/atmospheric indicators to get a general idea of how the season may turn out. Let’s start with the ocean.
Part 1: Ocean Temperatures
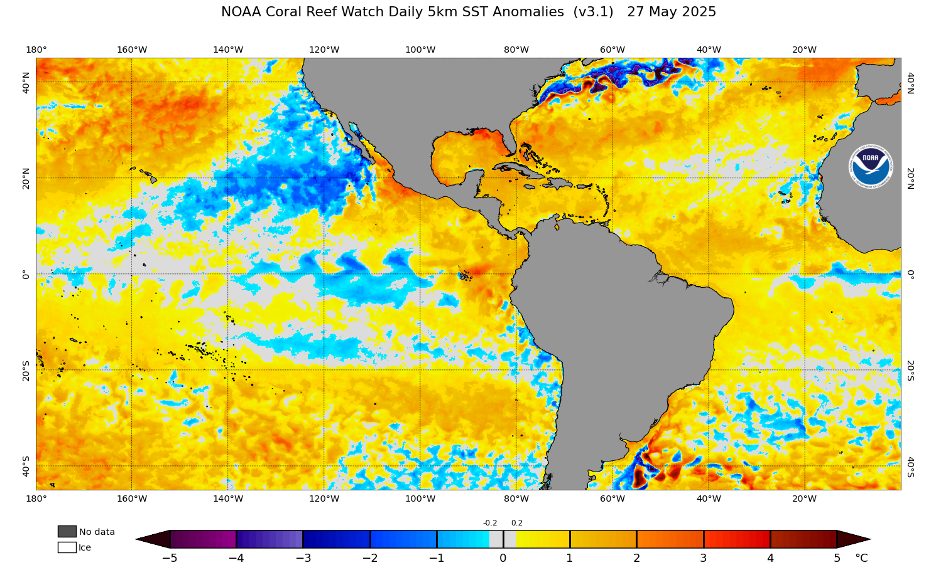
Figure 1: Sea surface temperature (SST) anomaly from NOAA Coral Reef Watch. Yellow, orange, and red colors indicate SSTs above the climatological average; blue colors indicate SSTs below average. Borrowed from: https://coralreefwatch.noaa.gov/product/5km/index_5km_ssta.php
The graphic above from NOAA shows that SSTs in the Atlantic are generally average to above average, with the highest anomalies located in the Gulf of Mexico [2]. This is in part thanks to extreme heat that has hit the southeastern U.S. over the last several weeks [3]. When we look at the tropical Pacific, which is another major player in Atlantic activity, we can see generally average to below average SSTs. This combination of warmer water in the Atlantic paired with cooler water in the tropical Pacific is generally conducive to an active hurricane season in the Atlantic [4]. However, the signal this year is a bit more muted when compared to prior years, especially last year (see Figure 2) [2].

Figure 2: Sea surface temperature (SST) anomaly from NOAA Coral Reef Watch for May 30, 2024. Note the much higher anomalies present throughout most of the tropical Atlantic. Borrowed from https://coralreefwatch.noaa.gov/product/5km/index_5km_ssta.php
2024 was a hyperactive hurricane season, albeit slightly less active than what original forecasts called for [5]. This is because although the oceans play a crucial role in the upcoming hurricane season, they are not the only factor. Let’s now look at some of the atmospheric features, which admittedly are much harder to predict this far in advance, but are factors that contribute to the activity in a hurricane season. When we discuss forecasts of hurricane activity, we are almost always discussing in terms of averages or general trends.
Part 2: Atmospheric Drivers
Atmospheric drivers of tropical cyclone activity include factors like wind shear, Saharan Air Layer or SAL (dry, stable airmasses that originate in the Sahara Desert and are usually associated with outbreaks of African dust), and sea-level pressure [4, 6, 7]. Wind shear in the Atlantic Ocean this year is generally forecast to be average to below average [4]. This is due to an expected neutral to slightly cool phase of the El Niño Southern Oscillation (ENSO) in the equatorial Pacific. When El Niño is present, wind shear anomalies tend to be positive during the hurricane season across the Atlantic [4]. However, in neutral to La Niña years (which is what is generally expected this year), these higher wind shear values are usually not present to the same degree. Thus, the forecast for wind shear appears favorable on average for tropical cyclones, but it is important to note that at any given time in the tropical Atlantic, wind shear could be favorable or unfavorable to a developing system. The actual outcome largely rests on chance, depending on which systems are developing where and what the wind shear looks like at any given moment.
Two other factors (SAL and sea-level pressure) are admittedly much more difficult to forecast in advance [4]. Outbreaks of dust in the SAL can have stabilizing effects on the atmosphere, suppressing convection and thunderstorm activity that is necessary for tropical cyclone formation [5, 11]. In some studies, the SAL has been observed to have increased in intensity and frequency over the last several years [7, 8, 9], and outbreaks of SAL do happen during the hurricane season [5]. As seen just last year during the hyperactive 2024 season, the SAL contributed to a marked lull in tropical cyclone activity between August 20 to September 23, which is usually the peak time for most Atlantic hurricanes to form [10]. Soon after the SAL waned the season bounced back with record activity including notorious Hurricanes Helene and Milton,.
Forecasts for sea-level pressure indicate average to below average values present across the tropical Atlantic throughout summer and fall of 2025 [4, 12]. However, these forecasts are usually a proxy for the SSTs, which play a factor in influencing the average sea-level pressure [12].
Part 3: Overall Thoughts and Outlook
With all of these factors in mind, what do we think about the overall season and how it may look? Signs this year generally point to an above average hurricane season, but that doesn’t necessarily mean that is how it will play out. As scientists at Colorado State University noted in their report, the best analog years for 2025 range from quiescent to hyperactive hurricane seasons, with more analog seasons being above average in activity rather than below [4, 12]. However, there is a large spread in outcomes, which also indicates a higher degree of uncertainty. Regardless of how the season turns out, anyone in the Caribbean, Gulf of Mexico, or along the Eastern Seaboard of the United States has the potential to be impacted. Now is the time for individuals and businesses to review their hurricane plan.
Here at Kinetic Analysis Corporation, it is our mission to provide you with critical, timely information before a storm strikes. We do this not only by providing you with a detailed view of the hazards (wind, storm surge, and rain) down to a less than 2 km area, but also the impacts associated with those hazards (economic losses, affected populations, and facility impacts). All this information is displayed globally in our state-of-the-art web app, KinetiCastTM. In addition, we also allow users the ability to upload their own asset information right onto our web app. Want to receive real-time alerts whenever a tropical storm/hurricane may affect you, including information such as the projected economic impact, evacuation time, and downtime? Reach out to us at sales@kinanco.com to request a free 15-minute consultation.
References
1. https://coast.noaa.gov/hurricanes/#map=4/32/-80
2. https://coralreefwatch.noaa.gov/product/5km/index_5km_ssta.php
3. https://www.sbsun.com/2025/05/13/extreme-heat/
4. https://tropical.colostate.edu/forecasting.html
8. https://pubmed.ncbi.nlm.nih.gov/35643146/
9. https://agupubs.onlinelibrary.wiley.com/doi/abs/10.1029/2023JD039681?utm_source=chatgpt.com
10. https://tropical.colostate.edu/Forecast/2024-11.pdf