

Our Data Solutions
Hazards
-
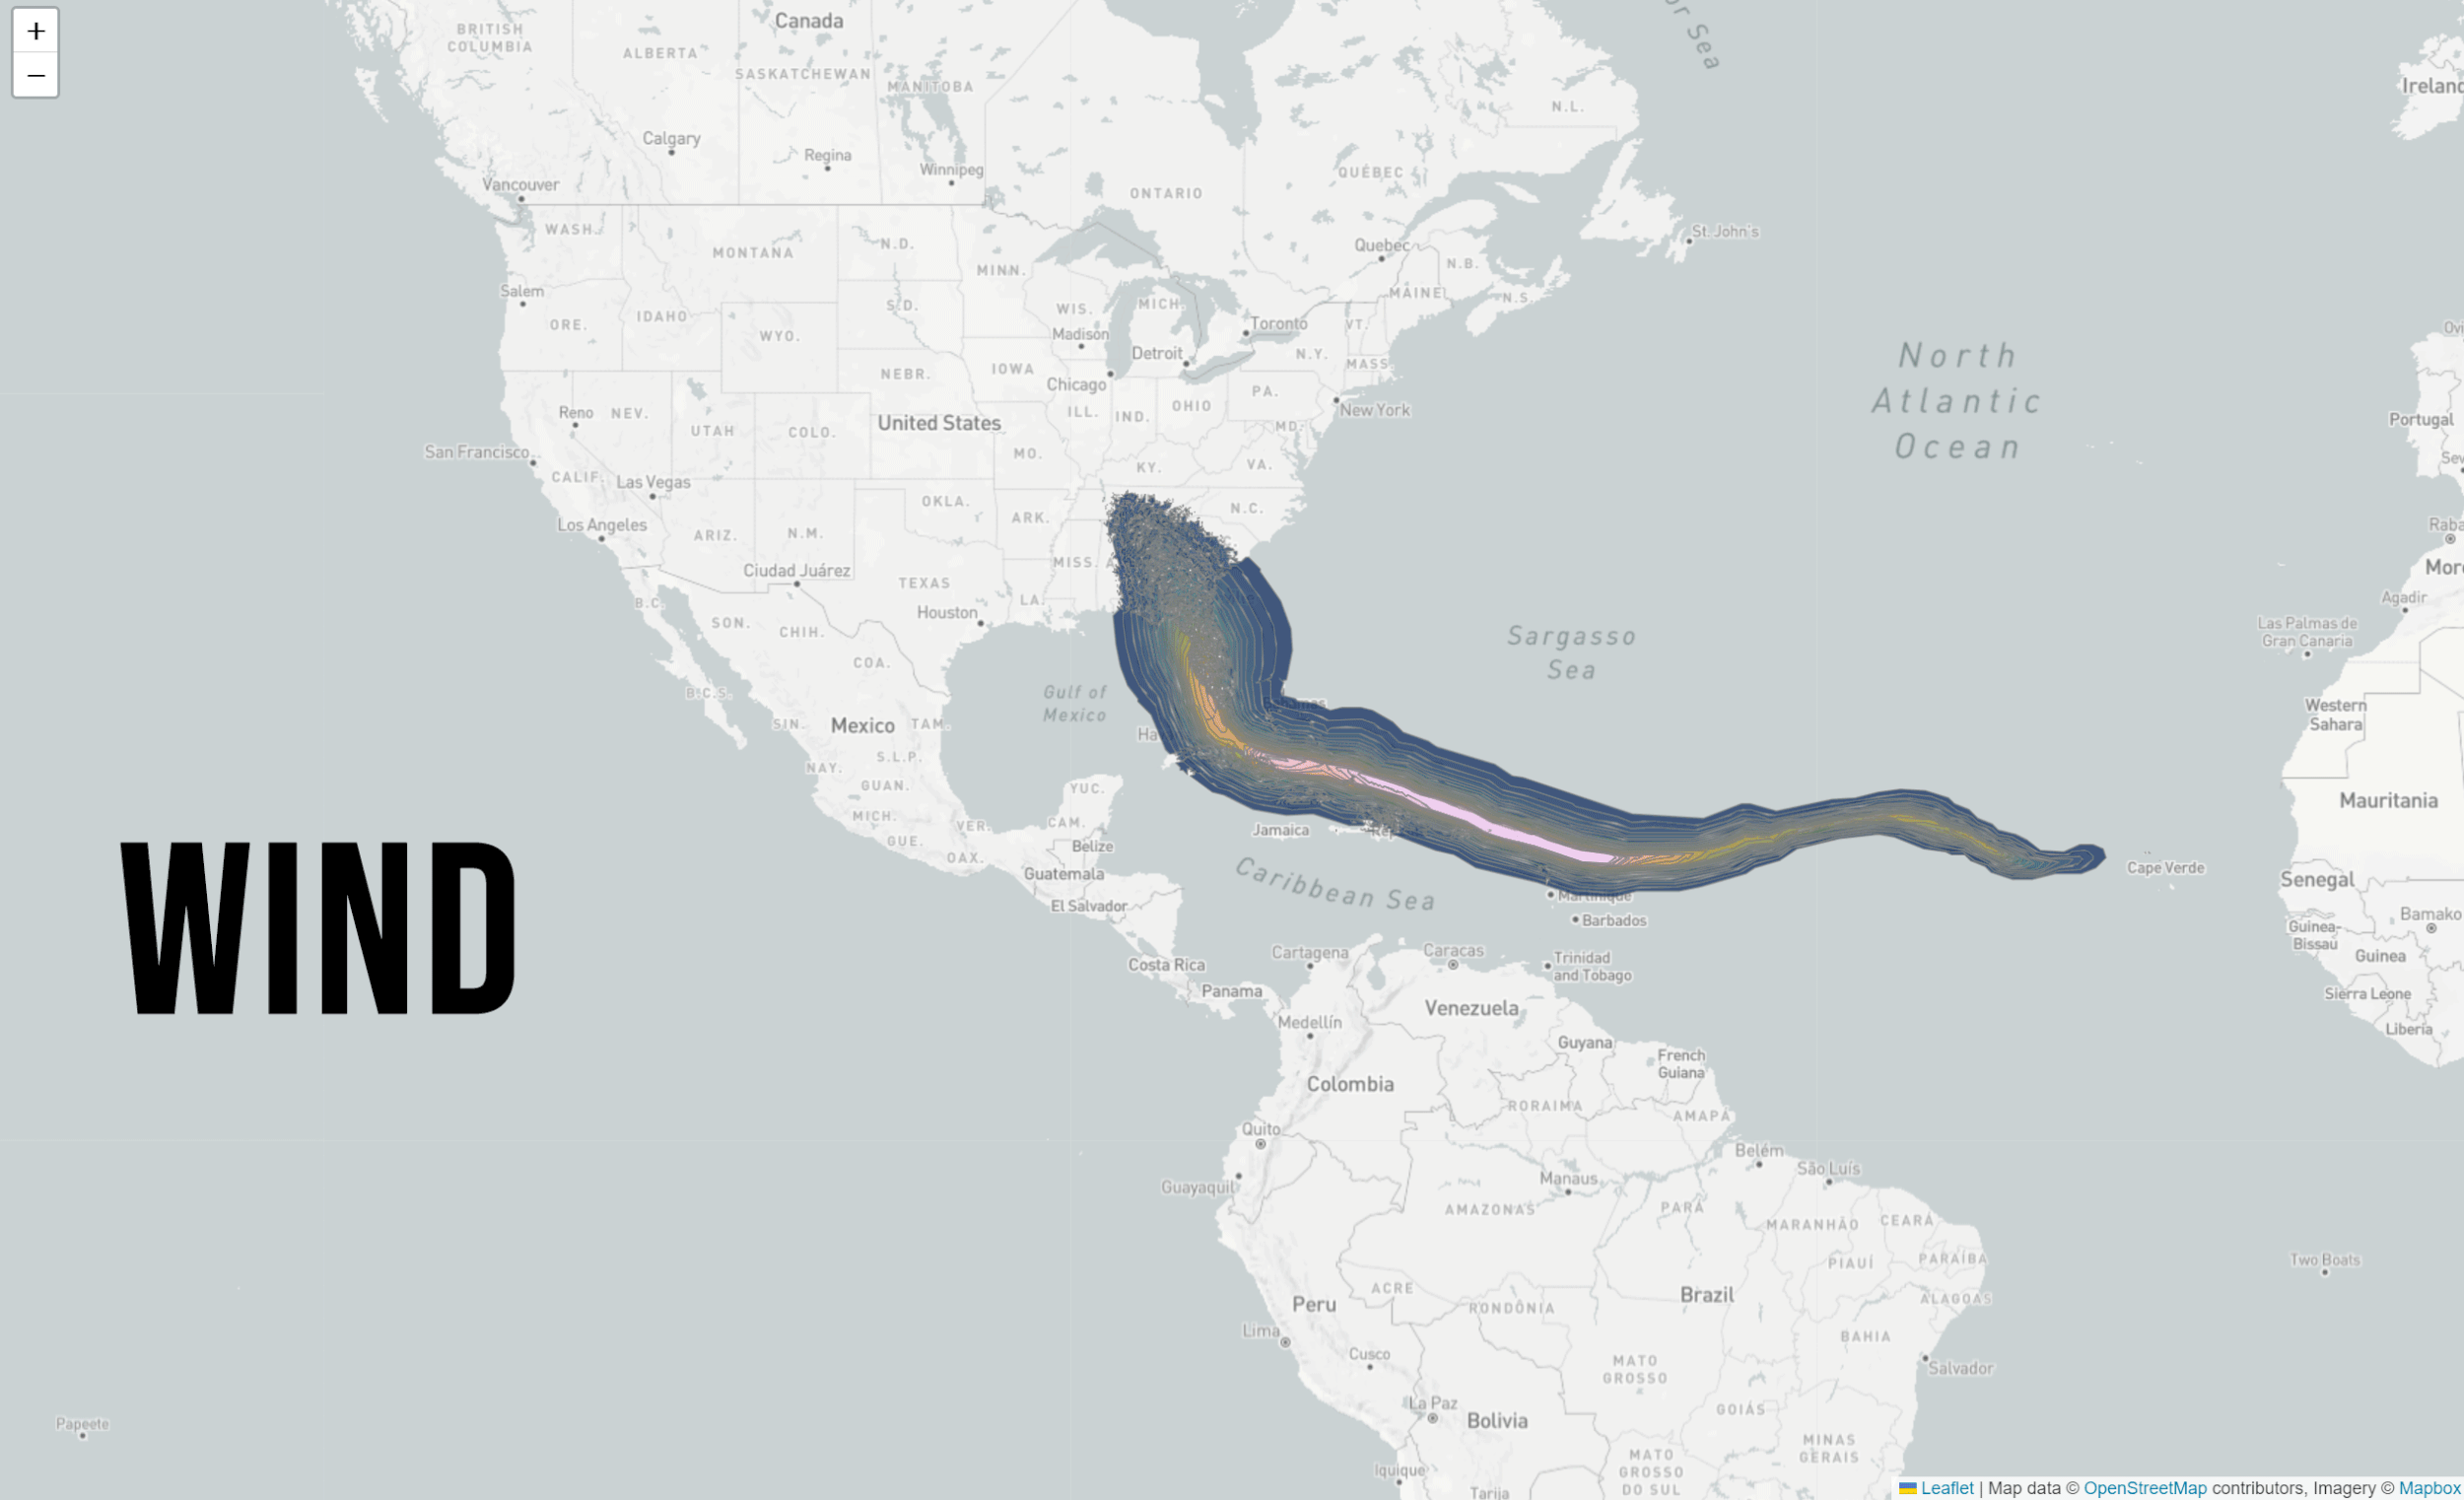
The standard winds offered by Kinetic Analysis Corporation represent 1-minute sustained winds at 10 meters elevation that are adjusted for topography and land use. The wind speeds reported by the US National Hurricane Center always represent winds over open terrain. As a result, over land our modeled winds will differ from those reported by the NHC.
For custom work, we offer winds for historical or real-time events, and for synthetic events for use in stochastic catalogs. These wind layers can:
Be based on a variety of boundary layer models
Have different averaging times for sustained winds or gusts, and
Be generated using different types of terrain.
-
Kinetic Analysis Corporation uses a seamless and globally consistent, high-resolution (15 arcseconds, or about 0.5 km) digital elevation and bathymetry model for real-time assessment of overland storm surge inundation. Surge heights are measured relative to mean sea level (MSL) over water and to land surface over land (as represented by the digital elevation model used in modeling). The reference datum is a globally consistent vertical MSL and horizontal (WGS-84 EPSG 4326) geographic coordinate system.
The modeled storm surge accounts for astronomical tides to capture the important non-linear interactions between astronomical tides and the wind, wave, and pressure setups that contribute to storm surge.
-
Wave height hazard layers depict the significant wave height above storm surge level in open water. Wave modeling is fully integrated with our wind and storm surge modeling throughout the full event simulation. This separates the effects in deep water from the more complicated interactions of sea and land which occur in shallow water.
-
Cumulative rainfall is based on a climatological parametric rainfall scheme. Total cumulative rainfall is directly associated with a tropical cyclone’s track and does not include external enhancement factors or precipitation that occur after transition from a tropical cyclone to an extra-tropical system.
Impacts
-
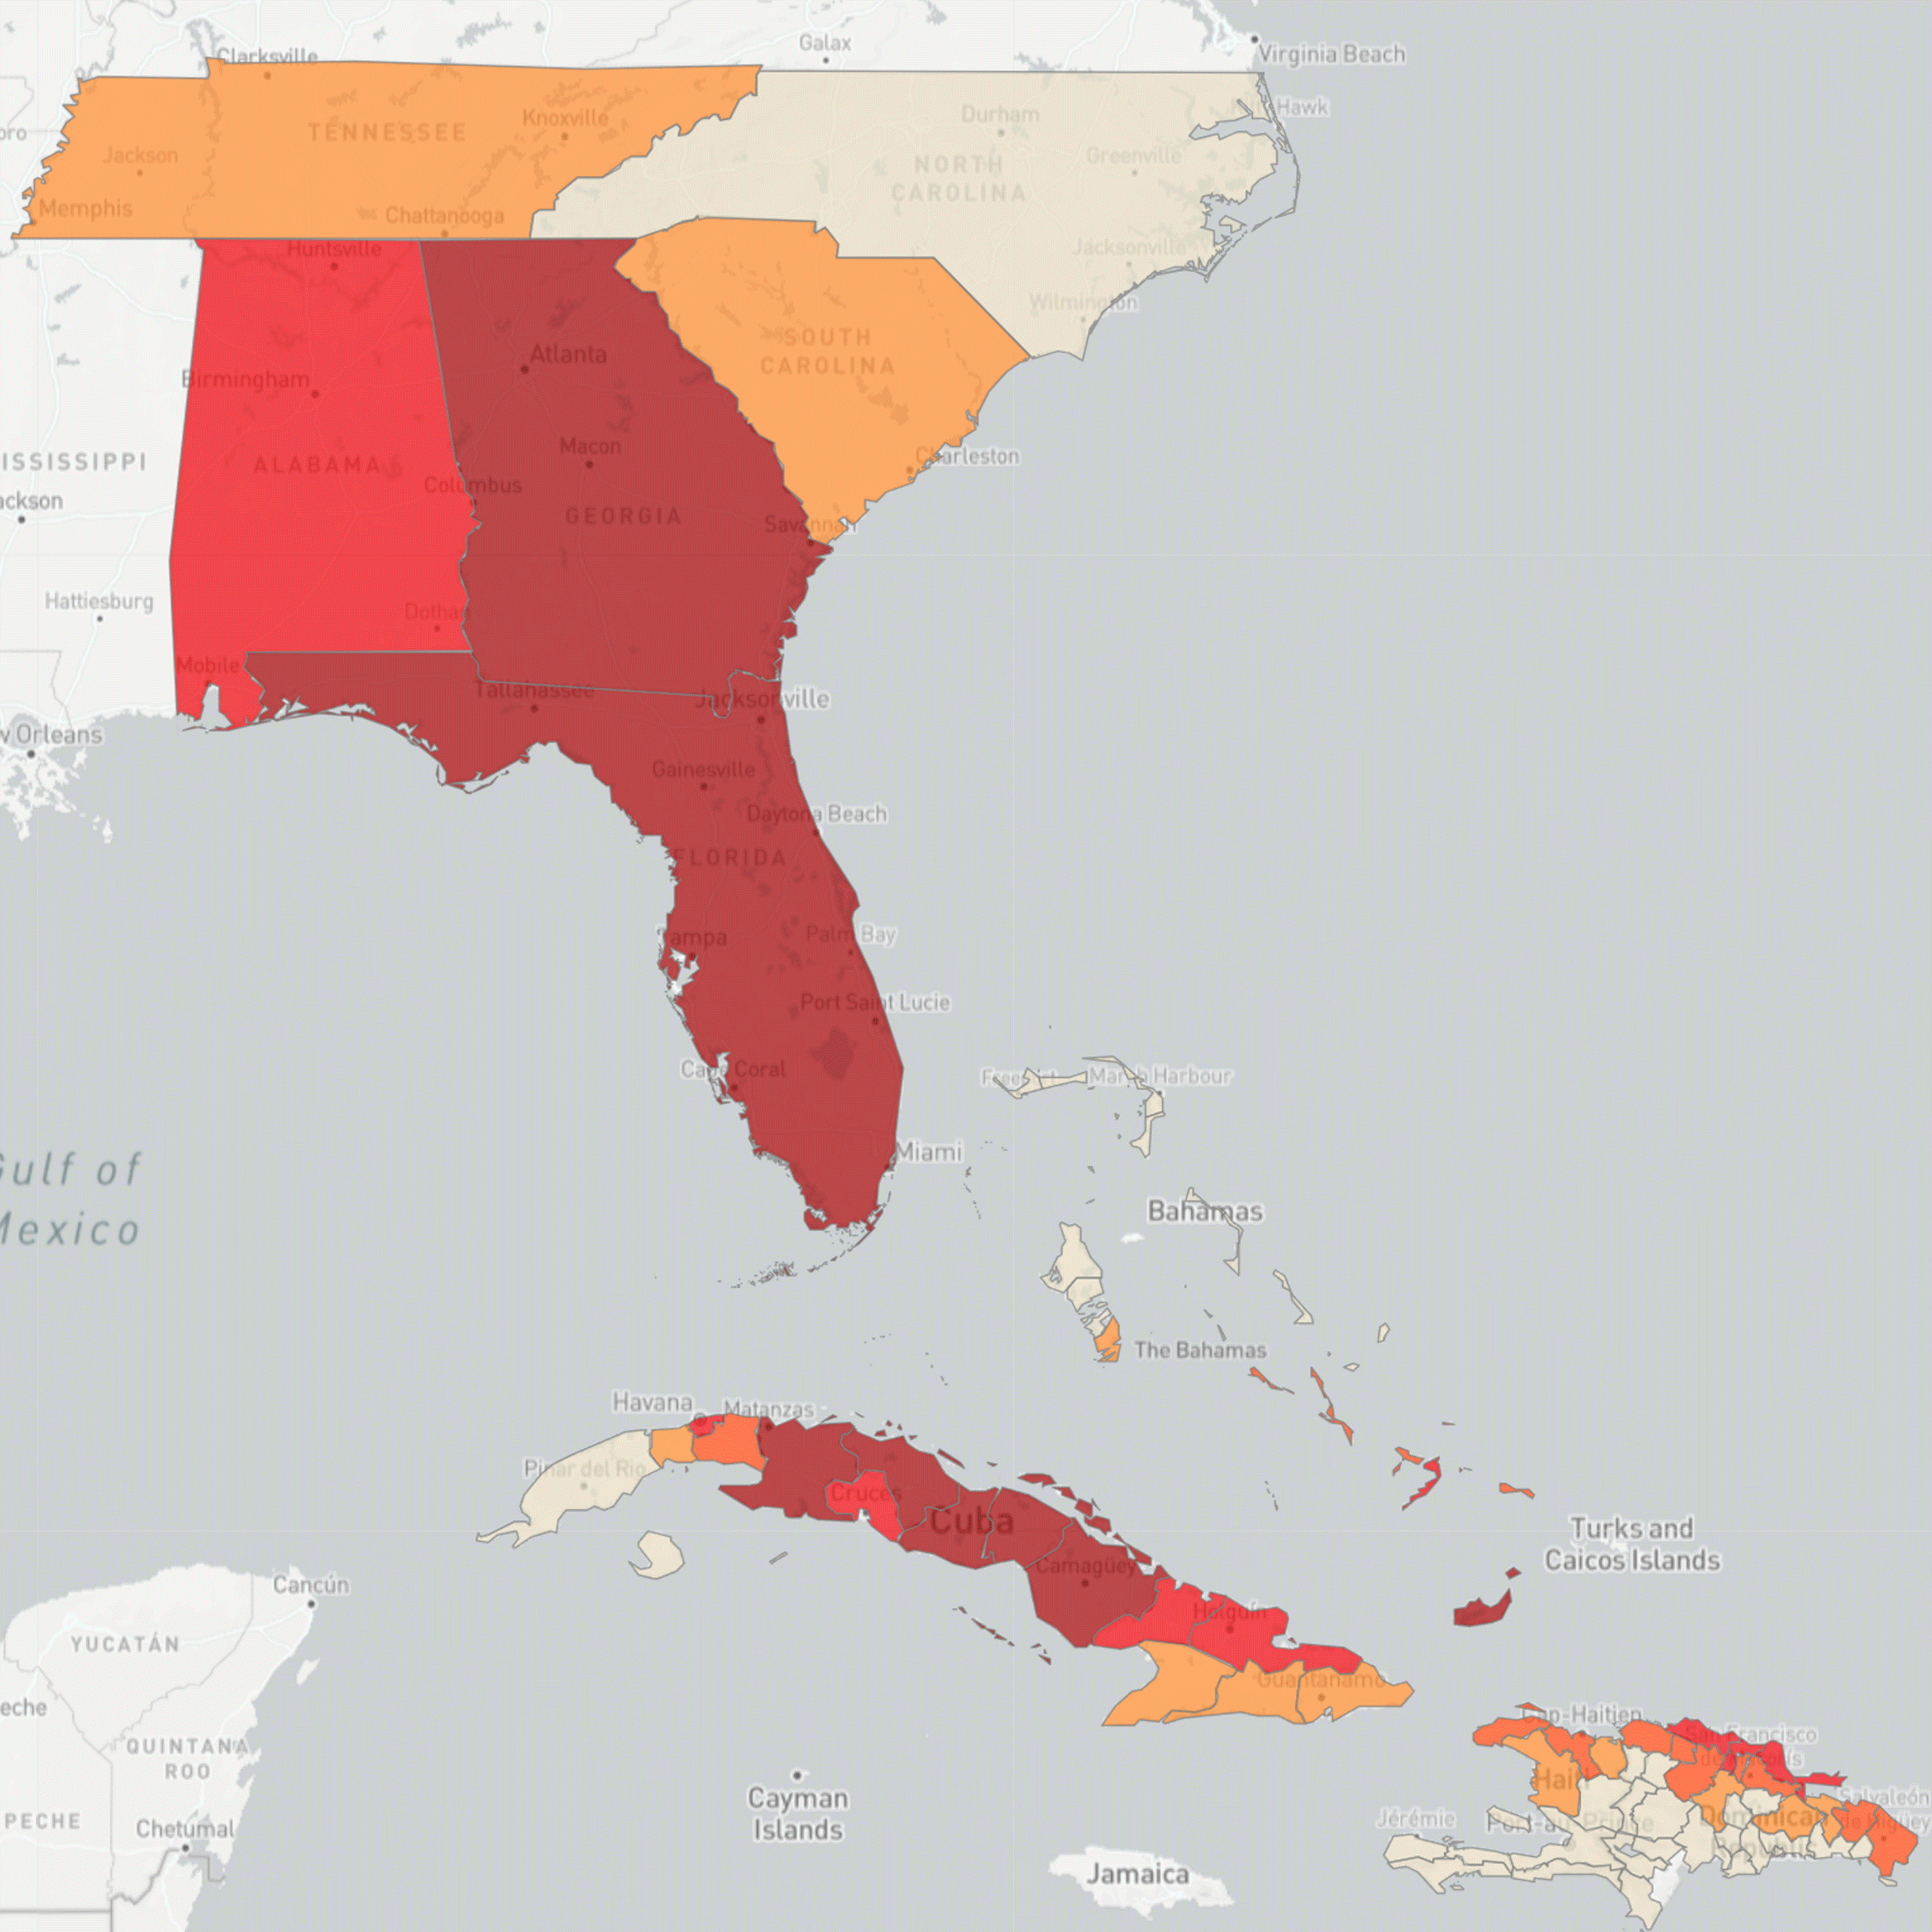
Kinetic Analysis Corporation uses our proprietary global exposure data and damage functions to estimate the economic impacts in US$ due to tropical cyclone winds and storm surge. Economic losses are aggregated to administrative areas equivalent to national, state, and county levels.
-
Affected population data represent estimates of the population affected by storm surge, winds equal to or exceeding tropical storm strength, and winds equal to or exceeding hurricane strength.
-
Facility impacts are presented in terms of damage to the structure and contents as well as the start time for impact based on a 24-hour window prior to the arrival of tropical storm force winds and the duration needed to completely recover from an event. The recovery time accounts for the time to full restoration of services and accounts for the estimated time to restore electricity and reconstruct all damage.
-
Add your assets of interest to receive email alerts when the National Hurricane Center (NHC) or the Joint Typhoon Warning Center (JTWC) issues a forecast that will affect your assets located anywhere in the world. You’ll receive estimates of: shut-down and evacuation times based on the arrival of tropical storm force winds; damage to contents and structures from winds and storm surge, and recovery times that account for wind duration, restoration of power, and time to rebuild. All you need to supply is an address or latitude and longitude. You need to provide structure and contents values to receive a damage estimate, or give a value of 1 to receive a damage ratio.
Multi-Model
-
Kinetic Analysis models tropical cyclone hazards and impacts using a variety of agency forecasts and weather model guidance. Multiple views of hazards and impacts provide the user a comprehensive look at what the future of a storm may entail and provide a unique view into the uncertainty associated with the future track and intensity of a tropical cyclone.
Kinetic Analysis produces hazard and impact data using forecasts from Regional Specialized Meteorological Centers for all ocean basins and computer model guidance from agencies such as the US National Oceanic and Atmospheric Administration, Environment Canada, the Japan Meteorological Agency, the UK Met Office, the Australia Bureau of Meteorology, and the European Centre for Medium Range Weather Forecasting. This allows Kinetic Analysis to provide real-time, optimized data for storms across the world by accessing sources specialized to regional weather events rather than only relying on one global source.
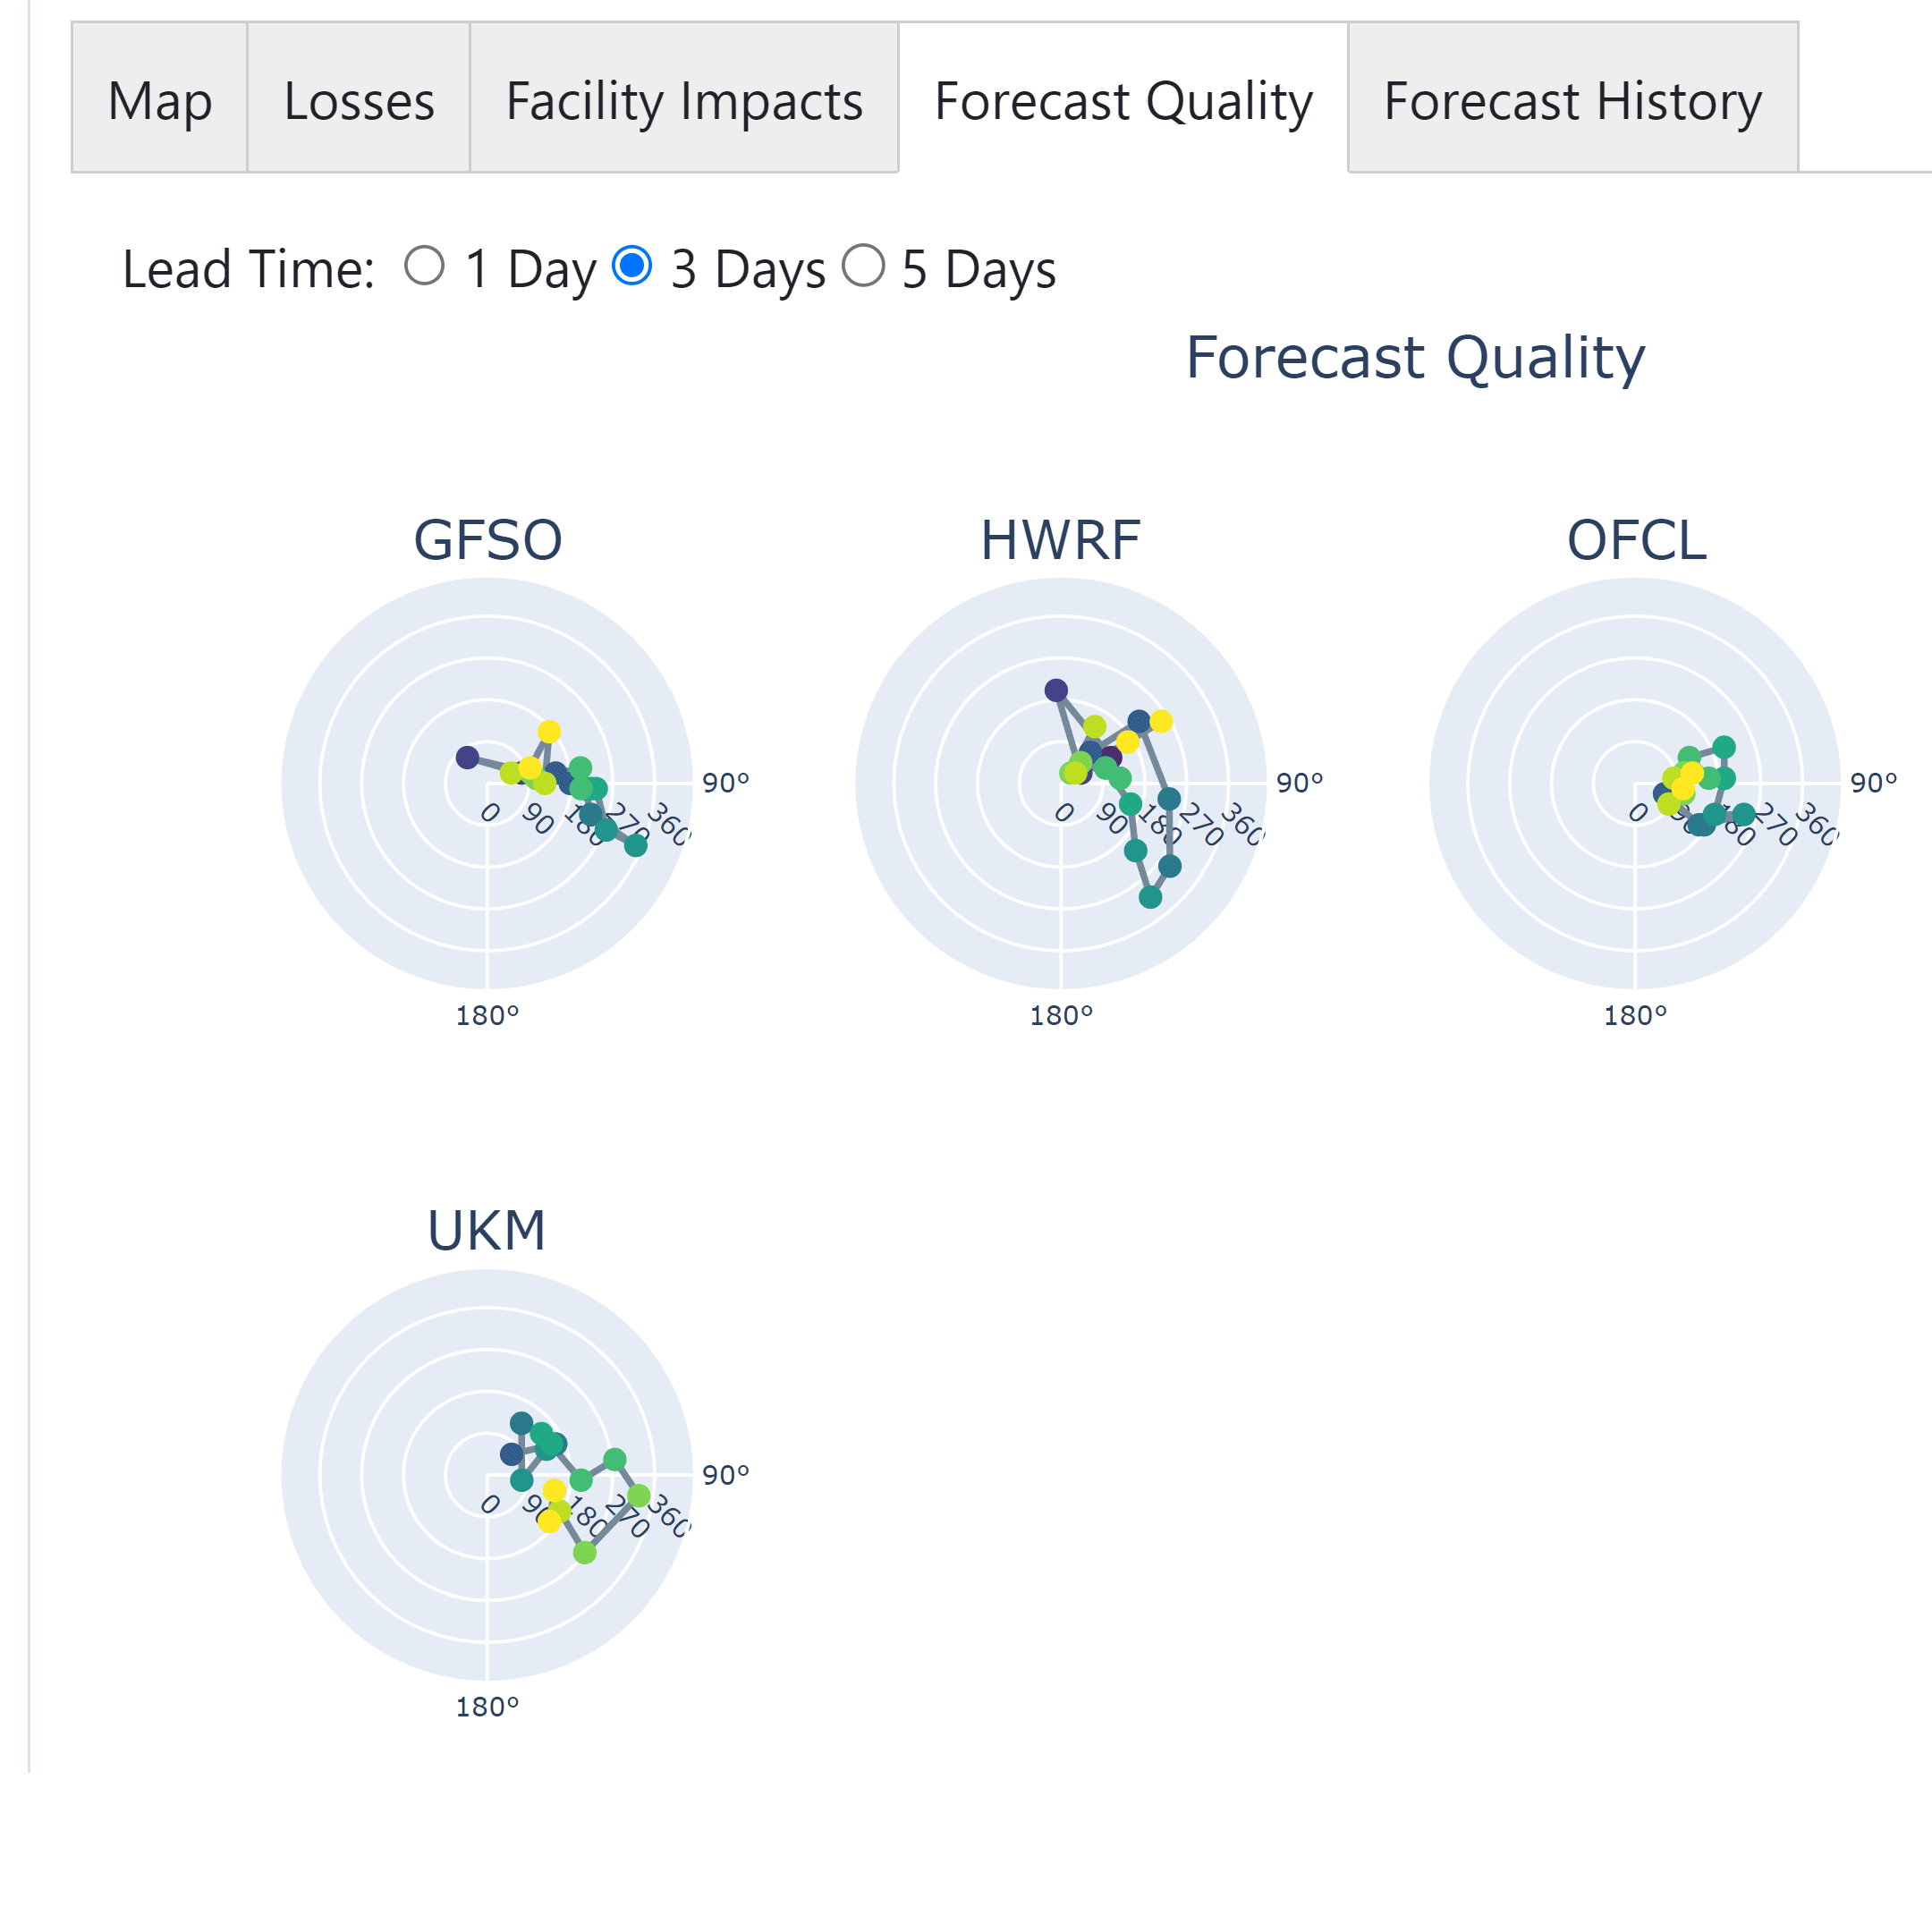
-
Kinetic Analysis provides information to assess model performance over the life of a storm using a customized version of a radar plot. The assumption is that the most fundamental test of a forecast is how well it can predict the location of a storm. If a storm’s location verifies perfectly with a forecast, then all the points in a radar plot will be dead center. The farther a storm verifies from its forecast location, the more distant the point from the center. The plot also provides information on whether a forecast trended too fast or too slow or to the right or left. A separate plot is used for each source of forecast or model guidance.
The forecast history presents a different means of comparing model performance. Forecast history depicts all the forecast sources in a single radar plot on a day-by-day animation.

Storms don’t wait,
why should you?
Whoever you are, wherever you work, investing in climate resilience is always worth the bet.