An Overview of Kinetic Analysis Corporation’s Hazard Modeling
Kinetic Analysis Corporation (KAC) is a leading provider in natural hazard and economic loss data. Since our inception in 2006, we have helped clients in a variety of industries including insurance/reinsurance, risk management, government agencies, and more. In our last blog post, we talked about the external data sources that KAC assimilates in order to produce our suite of products. That post described how once we’ve incorporated and parsed all the meteorological forecasts and data from the official agencies, we can begin to produce our hazard layers (simulated wind, storm surge, and waves). Our hazard layers are available in past, forecast, and swath versions (the swath layer is the combination of the past and forecast layers). Here we describe how we go about generating the hazard layers.
The standard hazard products are raster (gridded) files of terrain-adjusted, maximum sustained winds at 10 meters elevation, maximum storm surge inundation over land (or above sea level over water), cumulative rainfall, and maximum significant wave height. The default resolution for our real-time, operational products is 60 arcseconds (2 km). The model parameters can be adjusted to create custom products. For example, the standard wind output can be adjusted to represent wind gusts or sustained winds at different times (e.g., 3-second gusts or 10-minute sustained winds) and over different terrain (e.g., open terrain over land).
The first hazard layer that we produce is the wind speed associated with a tropical cyclone. This layer is generated by reading the ATCF file for the given storm. ATCF stands for Automated Tropical Cyclone Forecasting System [1]. KAC can generate hazard layers using ATCF data based on forecasts issued by all the Regional Specialized Meteorological Agencies (RSMCs) such as the National Hurricane Center, other agencies such as the Joint Typhoon Warning Center, or from model guidance based on global and regional models (e.g., NOAA’s new HAFS model or the ECMWF’s model). The ATCF file for a storm contains information such as a storm’s position (latitude and longitude), maximum sustained wind speed, the radius of maximum winds, etc. [1, 2]. The ATCF file provides the core of what goes into KAC’s hazard models that produce geospatial estimates of winds, storm surge, rainfall, and wave height. Our hazard data is updated whenever new ATCF data are available.
The raster data can be used directly, or converted to vector data with units that are convenient for visualizing results. The final product provides the user with a detailed view of the potential maximum wind speeds (Figure 1) or storm surge inundation (Figure 2).

Figure 1: Hazard layer for the wind speed generated by Kinetic Analysis Corporation. This hazard layer is generated using our custom tropical cyclone model and input data based on an official forecast from the National Hurricane Center. This near-real time data has a 60 arcsecond (~2-kilometer resolution) depiction of the forecast wind field for Hurricane Ian. The colored polygons indicate the level of wind that a location may see based on the forecast, and the highlighted blue polygon illustrates the specific locations that may see sustained, terrain-adjusted, 1-minute winds of 125-130 mph.
Storm surge and waves are wind-driven hazards; these layers are produced once the hazard layer for the wind is generated. The modeled storm surge includes the cumulative effects of pressure setup, wind setup, wave setup, wave runup, and the astronomical tide at the time of landfall. To better simulate storm surge, KAC uses a custom integrated topographic-bathymetric model. An example of storm surge graphics is shown below for Hurricane Irma in 2017 (Figure 2).

Figure 2: Hazard layer for the storm surge generated by Kinetic Analysis Corporation. The hazard layer is based on official forecast data from the National Hurricane Center and has been processed through our custom ocean and atmosphere models to produce a 2-kilometer resolution depiction of the forecast storm surge for Hurricane Irma. The hurricane symbol shows the storm’s current position, and the dashed line shows the forecast track. The colored polygons indicate the storm surge that a location may see based on the forecast, and the highlighted blue polygon illustrates the specific locations that may see a storm surge of 15 to 20 feet based on the official forecast. Storm surge in the ocean is due to the combined effect of the drop in atmospheric pressure and waves.
Kinetic Analysis Corporation products are used for a range of applications from real-time estimates of forecast hazards to probabilistic risks from tropical cyclone hazards. For example, KAC recently produced a global, historical catalog of tropical cyclones occurring since 1950 for the Atlantic and Eastern Pacific (since 1980 for all other basins). We use this historical catalog to estimate return period estimates for wind, storm surge, and waves due to tropical cyclones. A return period is equivalent to the inverse of the annual probability of meeting or exceeding a threshold value of a hazard. For example, a 25-year return period for an event is equal to a 0.04 probability, or a 4% chance, of occurrence in a year. A sample wind return period map for the western Atlantic and southwest Indian Ocean is shown in Figure 3.
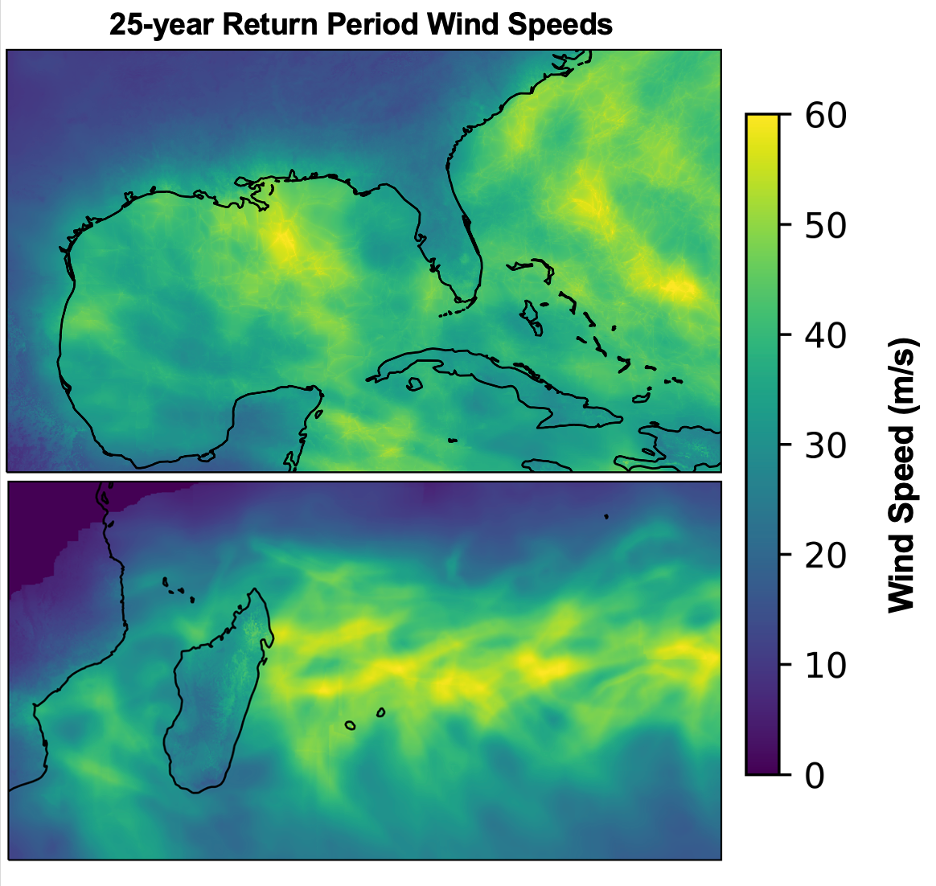
Figure 3: Maps of 25-year return period wind speeds from tropical cyclones in two regions: (top) the Gulf of Mexico and western Atlantic and (bottom) the southwest Indian Ocean and southeastern coastline of Africa. The 25-year return period wind speeds shown in the top figure are based on the National Hurricane Center's best-track data for tropical cyclones that occurred from 1950 through 2021. The winds shown in the bottom figure are based on the Joint Typhoon Warning Center's best-track data for tropical cyclones that occurred from 1980 through 2021. The winds represent terrain-adjusted, 1-minute sustained winds at 10-meter elevation. Note that winds equal to or faster than the return period winds can occur more than once in a year, or in consecutive years.
With our ability to determine real-time as well as historical risks associated with tropical cyclones, KAC can help prepare insurers, government agencies, emergency managers, and many others for the threats posed by a tropical cyclone’s hazards. If you would like more information, please reach out at aagastra@kinanco.com.
References
1. https://doi.org/10.1175/1520-0434(1990)005%3C0653:TATCFS%3E2.0.CO;2
2. https://www.nrlmry.navy.mil/atcf_web/docs/database/new/abrdeck.html