
Unusual June in the Tropical Atlantic: What Could it Mean for the 2023 Hurricane Season?
Last week, we tracked Tropical Storm Bret as it formed in the deep tropical Atlantic between the Cabo Verde Islands and the Lesser Antilles [1]. Coined the Main Development Region (MDR) since it is where most Atlantic tropical disturbances originate from tropical waves coming off Africa, this region is typically not conducive to the formation of tropical cyclones during the month of June [2]. In fact, Tropical Storm Bret was the farthest east an Atlantic tropical cyclone had formed this early in the calendar year on record [3]. And yet, Bret was not an isolated case, as the formation of Tropical Storm Cindy behind it in the same month was truly unprecedented [1, 21]. With two tropical cyclones forming in a climatologically unfavorable portion of the Atlantic during the month of June, it begs the question: why is this happening, and what could it mean for the remainder of the hurricane season?
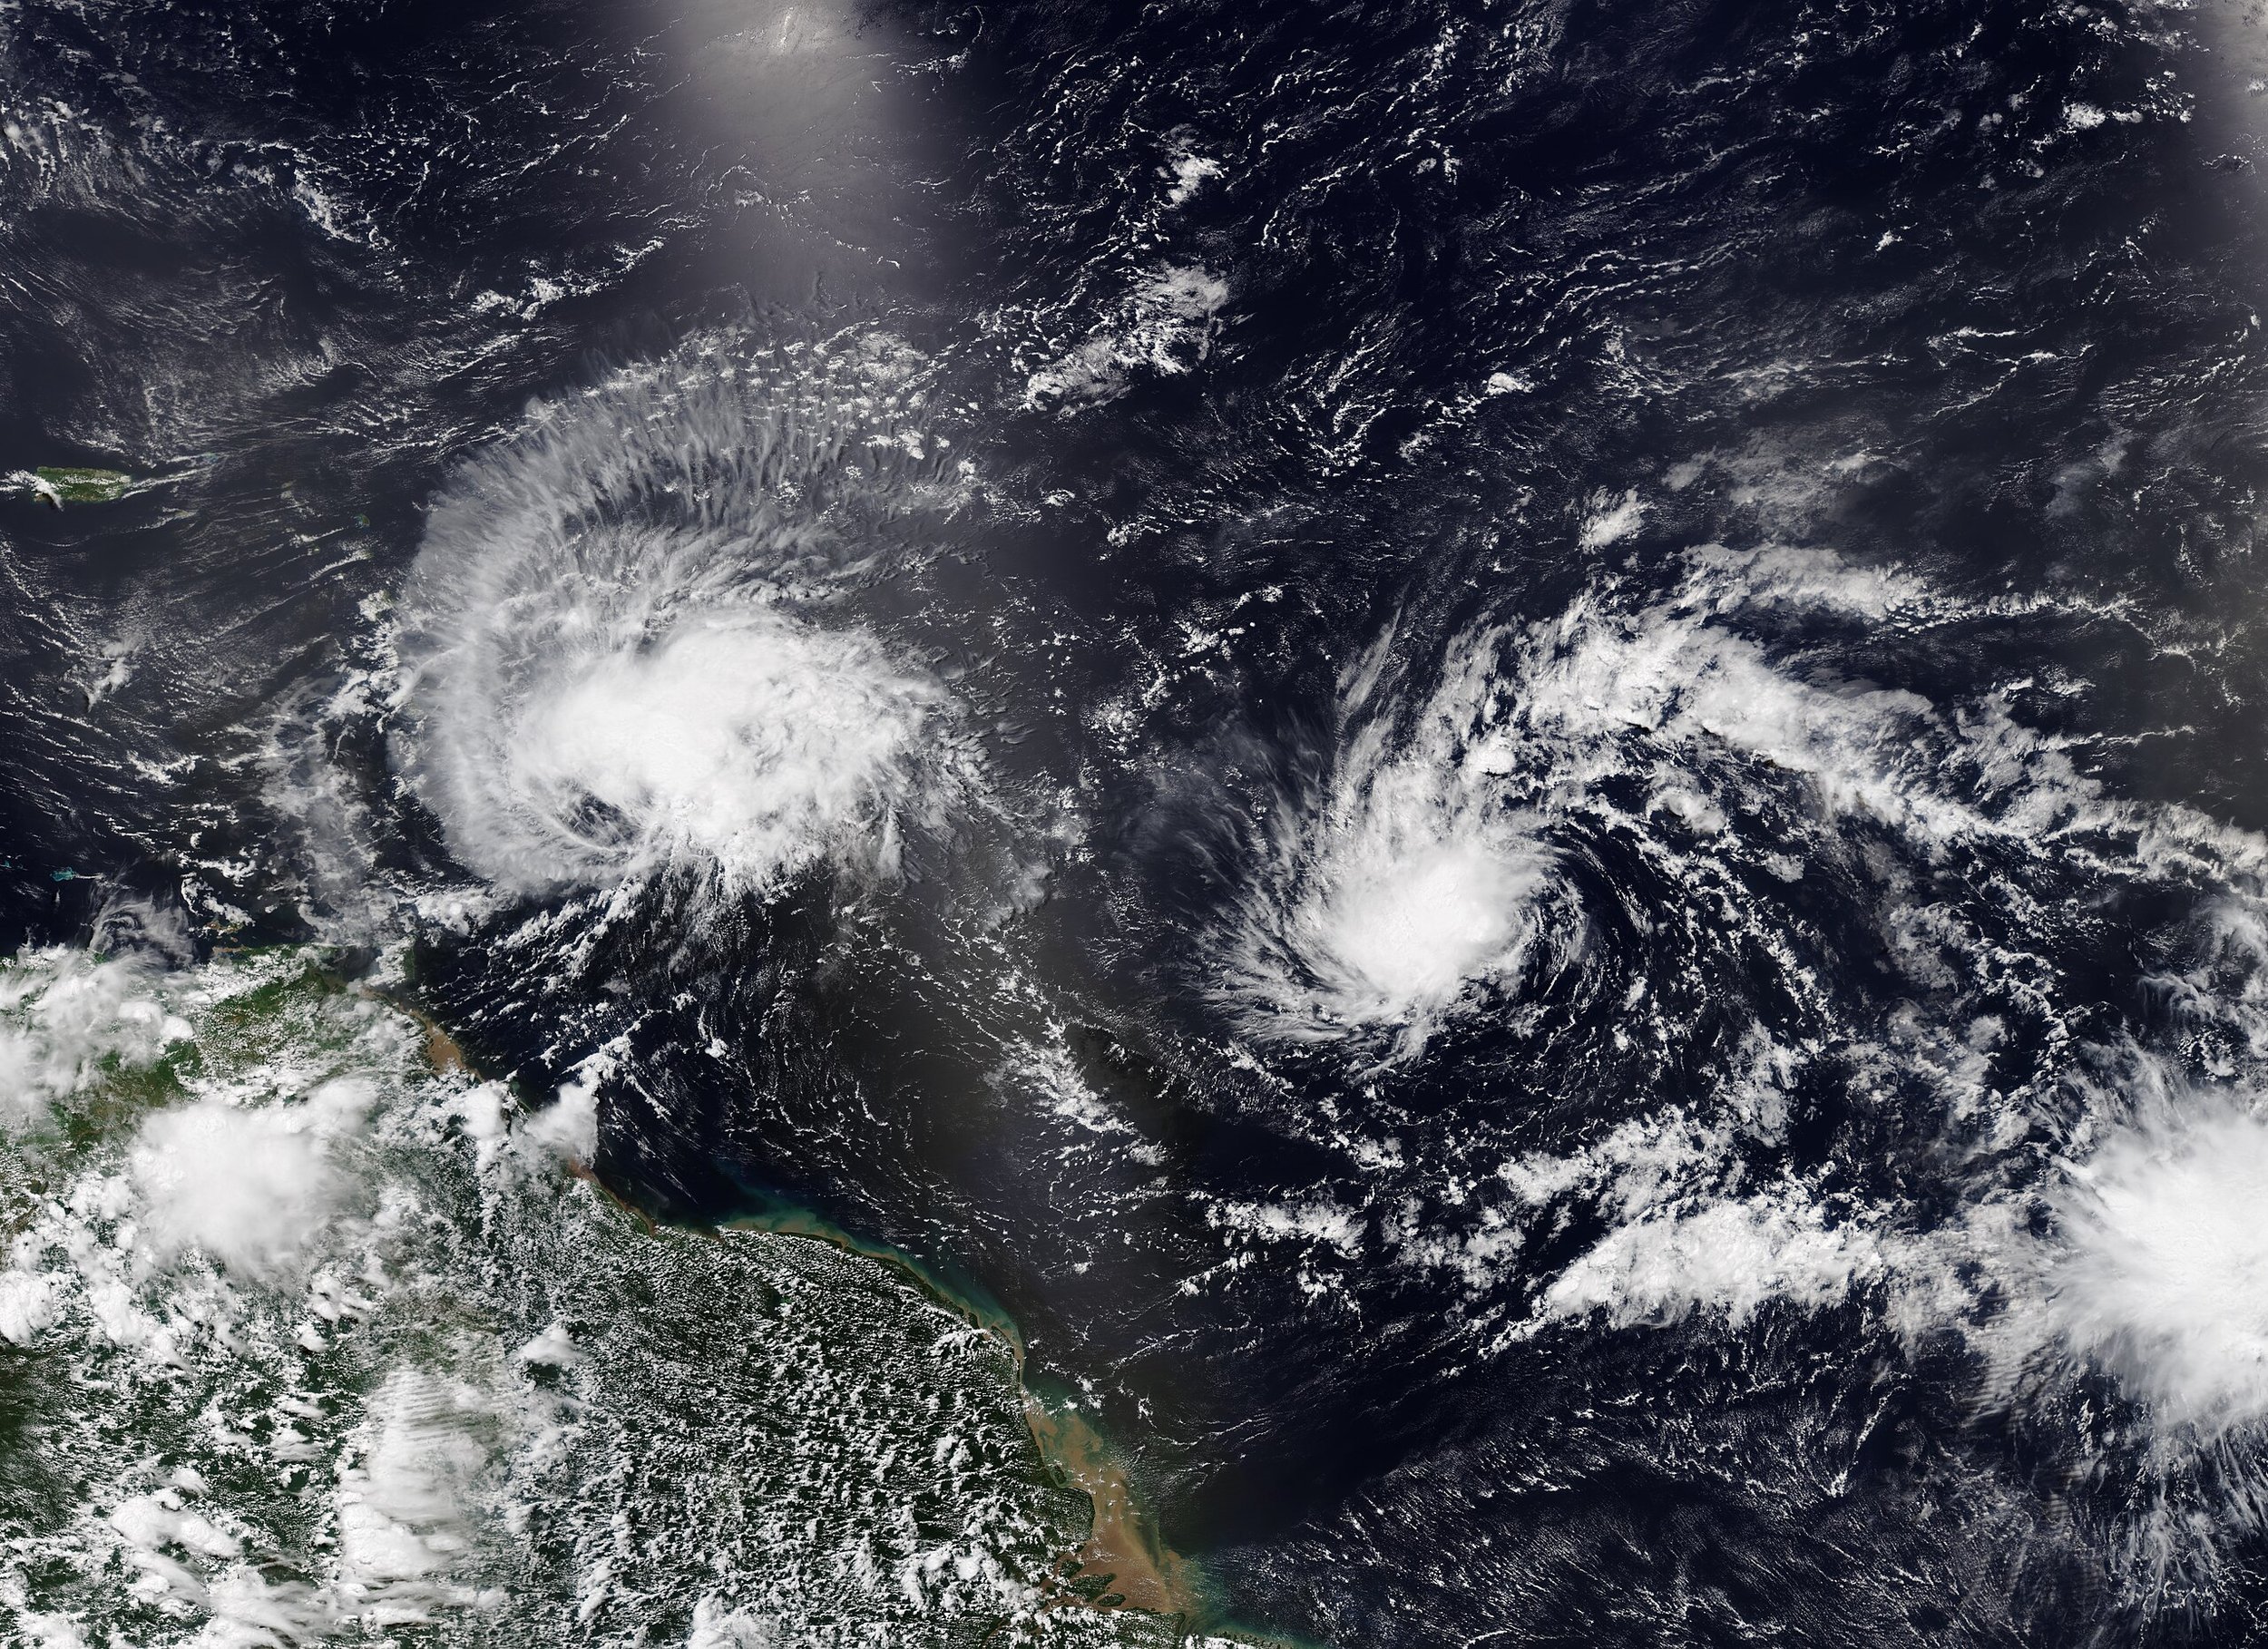
Two tropical cyclones occurring simultaneously in the tropical Atlantic, an impressive feat for the month of June. Tropical Storm Bret is to the left and Tropical Depression Four, which would later become Tropical Storm Cindy, is to the right of Bret. Image borrowed from https://worldview.earthdata.nasa.gov/.
It can help to look at the environment in which these systems are forming, starting with the sea surface temperatures (SSTs). SST anomalies, which measure how warm or cold the surface of the ocean is relative to “normal” (in this case, a 1981-2010 average), are running much above average in the tropical Atlantic for this time of year (Figure 1) [4, 5]. In fact, the average anomaly in the Main Development Region was above 0.8°C at the time of Bret’s formation (Figure 2), with many areas seeing 1-2°C anomalies or higher [5]. This means that when considering the tropical Atlantic SST pattern alone, the environment in the MDR is more characteristic of August than June [6]. This is one key ingredient that explains the formation of Tropical Storms Bret and Cindy, as tropical cyclones rely on warm sea surface temperatures to develop thunderstorms [7].
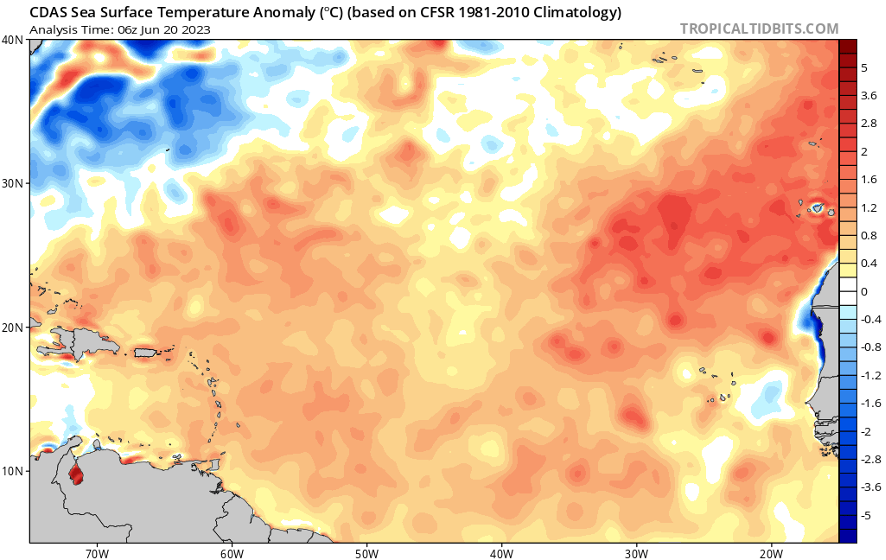
Figure 1: Sea surface temperature anomalies, calculated relative to a 1981-2010 average, for the eastern tropical Atlantic Ocean. The orange and red colors are areas where water temperatures are running much above average for this time of year. Figured borrowed from https://www.tropicaltidbits.com/analysis/ocean/.
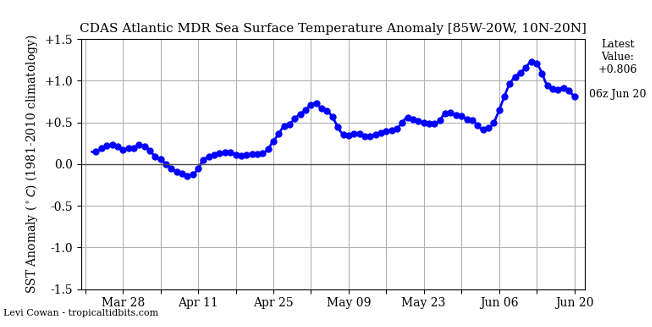
Figure 2: Trend in average sea surface temperature anomalies for the Atlantic MDR. Figure borrowed from https://www.tropicaltidbits.com/analysis/ocean/.
However, the favorable SST configuration is not the only factor explaining the unusually active June MDR. Vertical wind shear, which is the change in wind speed/direction with height, has also been running lower than normal in the Atlantic MDR (Figure 3) [5, 8]. Tropical cyclones are vertically stacked systems – think of a vertical column of air or “tube” – that draw in air, heat, and moisture from the surface all the way up the top of the system [8]. If this vertical structure gets disrupted, usually through a variation of wind speed or direction with height – in other words, vertical wind shear - then the tropical cyclone can become a tilted rather than a stacked vortex. In turn, this disrupts the cyclone’s ability to focus moisture and heat energy over the same area – i.e., the energy source gets “spread out,” causing the system to weaken [8].
Figure 3 shows a 5-day average (June 15 at 18 UTC to June 20 at 18 UTC) wind shear anomaly for the Atlantic MDR [5], demonstrating how wind shear near where Bret and Cindy formed is running below normal for this time of year. However, it is important to note that the wind shear is not nonexistent, as 15 to 20 knots of vertical wind shear was still impacting the systems at the time of their formation (anything above 20 knots would make storm formation unlikely at all), and this only seemed to increase as the systems made their way out of the MDR [5]. We are still in June, after all, and more favorable conditions than the norm does not equate to ideal conditions for tropical cyclone formation. Nonetheless, it is also worth noting that the Saharan Air Layer – a measure of the dry, stable air mass that originates from the Sahara Desert in Africa – has also been observed to be lower than normal so far this season, contributing to the favorable conditions for storm formation [9].

Figure 3: 5-day average (June 15, 1800 UTC to June 20, 1800 UTC) 850-200 mbar wind shear anomaly for the tropical Atlantic. Cool colors indicate lower wind shear than normal for this time of year, while red colors indicate higher than normal shear values.
Figure borrowed from https://www.tropicaltidbits.com/analysis/models/.
WHAT CAN WE EXPECT FOR THE 2023 HURRICANE SEASON?
With all this in mind, you may be asking what this unusual activity in the month of June could mean for the rest of the Atlantic hurricane season. In past years, premature formation of tropical cyclones in the Atlantic MDR has often correlated with an above average Atlantic hurricane season in terms of overall activity [10, 11]. This does not necessarily mean more U.S. landfalling hurricanes or even a greater proportion of storms affecting land, but it can sometimes indicate that the peak of the season will feature more activity than normal. However, there are exceptions to this, and it is important to look at all factors in determining how active (or inactive) a hurricane season may be. We have already discussed the favorable factors thus far this season – the higher-than-normal SSTs, the lower-than-normal wind shear, and the overall moister environment that these systems are finding themselves in once they emerge off the coast of Africa. Another big player in determining how active an Atlantic tropical cyclone season may be is the El Niño Southern Oscillation (ENSO) [12].
ENSO is a recurring climate pattern involving changes in the sea surface temperature of the equatorial central and eastern Pacific Ocean [12]. The warm phase, regarded as “El Niño,” occurs when the central and eastern tropical Pacific is warmer-than-normal by at least 0.5°C on average [12, 13]. This warming causes large downstream climate impacts around the globe, including in the Atlantic [12]. The warmer SSTs in the central and eastern Pacific enhance the number of thunderstorms and convection taking place there [14]. In turn, these systems generate strong upper-level winds that flow into the Atlantic basin, often disrupting developing tropical cyclones there [14]. In other words, through its enhancement on thunderstorm activity/convection in the tropical Pacific, El Niño tends to increase overall wind shear in the Atlantic. As highlighted earlier on, wind shear is a prohibitive factor for budding tropical systems, and strong El Niño events in the Pacific tend to be correlated with below average tropical activity in the Atlantic in any given year [14]. A weak El Niño event has already developed in the tropical Pacific, and current projections call for at least a moderate to strong El Niño to develop by late summer/early fall [15, 16]. This, in turn, will likely cause above-average levels of wind shear across much of the Atlantic during the peak of hurricane season.
It’s important to tie everything together into the overall Atlantic hurricane outlook for the remainder of the season. Should SSTs in the tropical Atlantic and MDR remain above average along with a reduced Saharan Air Layer, then the main limiting factor for developing tropical systems would be the higher-than-normal wind shear imparted by El Niño [14]. In other words, the factors in the Atlantic are likely to compete with one another this season, which makes discerning overall activity more difficult [17].
One aspect to note, which aligns with what we have already seen, is that El Niño tends to elevate overall wind shear more in the Gulf of Mexico, Caribbean Sea, and western Atlantic [18]. The MDR off Africa, while still affected, is farther away from the eastern Pacific and therefore does not experience as strong of a spike in wind shear during an El Niño [18]. What this might suggest is that the MDR could remain rather active even in a strong El Niño event (given the otherwise favorable conditions we are seeing across the Atlantic); however, these systems may then run into more negative factors the farther west they move across the Atlantic. This could be good news for land masses in the Caribbean and the United States, but it does not guarantee a lackluster season for those areas. Seasonal hurricane forecasts rely on the statistical likelihood of how active or inactive a season may be [19], but record-breaking hurricanes occur even in the most statistically unfavorable of hurricane seasons. Take Hurricane Andrew, which occurred during a strong El Niño event back in 1992 but was the most costly landfalling tropical cyclone in the United States at that time [20]. The point is, regardless of how El Niño may dampen what may have been an otherwise hyperactive hurricane season for the Atlantic Ocean, agencies and individuals should not let their guard down during any hurricane season.
Here at Kinetic Analysis Corporation, we work hard no matter the season, no matter the basin, to provide you with timely and accurate forecasts and assessments of the hazards and impacts from tropical cyclones. Our clients include some of the largest insurance companies, federal agencies, and emergency managers. If you would like more information about the products and data we provide, please reach out to aagastra@kinanco.com.
References
1. https://www.nhc.noaa.gov/
2. https://weather.com/storms/hurricane/news/2023-06-22-tropical-storm-hurricane-bret-cindy-three
3. https://www.axios.com/2023/06/19/tropical-storm-bret-forms-warm-atlantic-hurricane
4. https://www.ncei.noaa.gov/access/monitoring/global-temperature-anomalies#:~:text=What%20is%20a%20temperature%20anomaly,cooler%20than%20the%20reference%20value.
5. https://www.tropicaltidbits.com
6. https://winknews.com/2023/06/13/warmest-june-so-far-in-the-northern-atlantic-ocean/#:~:text=The%20Main%20Development%20Region%20has,Region%20in%20the%20Atlantic%20Ocean.
7. https://www.e-education.psu.edu/meteo3/l12_p5.html
8. https://www.weather.gov/source/zhu/ZHU_Training_Page/tropical_stuff/hurricane_anatomy/hurricane_anatomy.html
9. https://www.local10.com/weather/2023/06/05/its-saharan-dust-season-but-wheres-the-dust/
10. https://abc13.com/tropical-storm-bret-2023-path-tracker-hurricane-season/13403425/
11. https://michaelrlowry.substack.com/p/what-a-sizzling-eastern-atlantic
12. https://www.weather.gov/mhx/ensowhat#:~:text=The%20El%20Ni%C3%B1o%2DSouthern%20Oscillation,and%20eastern%20tropical%20Pacific%20Ocean.
13. https://www.weather.gov/fwd/indices
14. https://www.climate.gov/news-features/blogs/enso/impacts-el-ni%C3%B1o-and-la-ni%C3%B1a-hurricane-season
15. https://www.cpc.ncep.noaa.gov/products/analysis_monitoring/lanina/enso_evolution-status-fcsts-web.pdf
16. https://iri.columbia.edu/our-expertise/climate/forecasts/enso/current/
17. https://www.scientificamerican.com/article/el-nino-and-extreme-ocean-heat-are-about-to-clash-for-the-2023-hurricane-season/#:~:text=During%20El%20Ni%C3%B1o%20events%2C%20the,shear%20in%20the%20Atlantic%20basin.
18. https://weather.com/storms/hurricane/news/2023-03-20-el-nino-atlantic-hurricane-season-2023
19. https://www.noaa.gov/news-release/2023-atlantic-hurricane-season-outlook
20. https://earthsky.org/earth/the-20th-anniversary-of-hurricane-andrew/
21. https://apnews.com/article/tropical-storm-bret-caribbean-weather-barbados-dominica-e2902edac76fd904cb2d3d780dc077b2
22. https://worldview.earthdata.nasa.gov/